This post reviews the backtest results for 4080 options straddles sold on the RUT at 45 days-to-expiration (DTE). Eight different loss approaches were tested on these straddles. On top of these eight loss approaches, tests were conducted with no profit taking, and profit taking at 10%, 25%, 35%, and 45% of the credit received. In future articles, the performance of trades initiated at other DTE (52, 59, 66, 73, and 80) will be explored. You can find the 38 DTE post here.
The results in this post are summarized in six heat map tables. In these tables, each row corresponds to a different loss exit percentage. For example, the first row (25) corresponds to the strategy variations where losses were taken at 25% of the credit received. These rows have values from 25 to 200. The columns are a little more complicated, and are grouped first by IV rank (IVR) level, and then by profit exit percentage. You can see that each IVR percentage level contains five columns (10, 25, 35, 45, and NA)...with each column representing a profit taking percentage. For example, the first column lists all of the strategy variations where the IVR was less than 25% and profits were taken at 10% of the credit received.
The first table shows the average normalized P&L per day by IVR, profit taking percentage, and loss taking percentage. The highest daily returns are concentrated in the IVR > 50% columns, specifically the column associated with profit taking at 35%. I will try to Tweet these specific equity curves sometime in the next few days.
 |
| (click to enlarge) |
The second table shows the average P&L per trade by IVR, profit taking percentage, and loss taking percentage. The area with the highest P&L per trade values was IVR > 50% and profit taking at 35%, 45%, and NA. Most of the P&L per trade numbers are higher for the 45 DTE variations compared to the 38 DTE variations...as you'd expect.
 |
| (click to enlarge) |
The third table shows the win percent / win rate by IVR, profit taking percentage, and loss taking percentage. The highest win rates occur at lower profit taking levels...the lower the profit taking percentage, the higher the win rate for a given IVR grouping. The highest win rates occur with an IVR < 25%, and profit taking at 10%....all of these variations have 93% win rates except for the (25:10) and (50:10) variations. This is a familiar pattern across DTE and products.
 |
| (click to enlarge) |
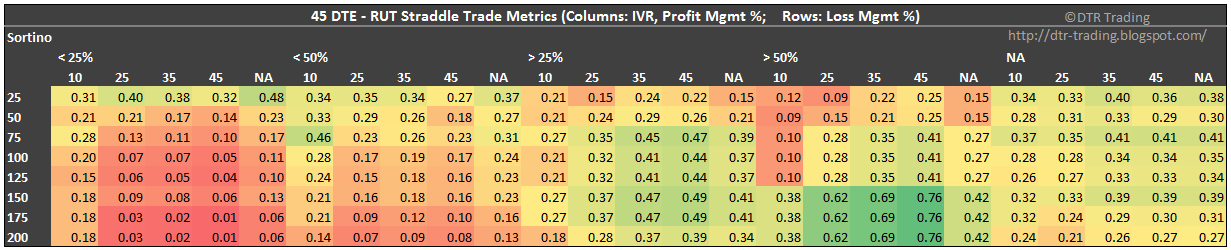
In the fourth table, we see the Sortino Ratio by IVR, profit taking percentage, and loss taking percentage. The highest Sortino Ratios were associated with the same IVR > 50% group, profit taking at 25%, 35%, 45% and loss taking at 150%, 175%, and 200%.
 |
| (click to enlarge) |
The fifth table shows the profit factor by IVR, profit taking percentage, and loss taking percentage. The largest profit factor values occurred at IVRs > 50%, profit taking at 10%, 25%, 35%, and 45%, and loss taking at 150%, 175%, and 200%. The variations with the highest profit factors were also the variations with the highest Sortino Ratios.
 |
| (click to enlarge) |
The last table shows the average days-in-trade (DIT) by IVR, profit taking percentage, and loss taking percentage. Quicker profit taking, translates into shorter time in the trade.
 |
| (click to enlarge) |
Which variation of the 45 DTE straddle is best? None of the variations really jump out at me as good options. If I was going to sell a 45 DTE ATM RUT straddle every month, I would likely go with the non-IVR filtered variation ... taking profits at 35%, with a loss threshold of 75%. This would put my gains at 50% of my losses (35/75), and a win rate at approximately 74%. When the IVR goes above 50% (at trade entry for new trades), I would increase position size and keep the profit and loss exits the same (or become more conservative with both).
In the next post, we will look at the automated backtest results for the short straddle on the RUT at 52 DTE.
Follow my blog by email, RSS feed or Twitter (@DTRTrading). All options are free, and are available on the top of the right hand navigation column under the headings "Subscribe To RSS Feed", "Follow By Email", and "Twitter". I follow blogs by RSS using Feedly, but any RSS reader will work.
No comments:
Post a Comment