As mentioned in the 38 DTE IC results summary post, these tests covered 9 IC variations, with short strike deltas at four locations, utilizing 12 exits. In all, there were 432 test runs (9 variations x 4 deltas x 12 exits). Each test run executed more than 200 SPX IC trades between the Jan-2007 expiration and the Sep-2016 expiration. I used weekly options for this testing, so there were more than 12 trades per year. In total, there were 96,624 total trades entered for the 45 DTE testing.
For an explanation of the nomenclature used in this article as well as the chart structure and composition, please read the first IC results post here.
Normalized P&L per Day
This first set of charts shows normalized P&L per day percentages. The P&L per day values are expressed as a percentage of the max risk for that test run...this is necessary in order to fairly compare the returns of each of the different wing widths (25 point, 50 point, 75 point).
The results:
- Similar to the 38 DTE ICs, there is more variability in P&L per day readings in the 25 point wing width ICs
- Again, similar to the 38 DTE ICs, as the delta of the short strikes increases, the variability in the P&L per day readings increases
- The largest reading was 0.18% and was associated with the three strategy variations:
- DN (300:50), 25 point wings, 20 delta
- DN (NA:50), 25 point wings, 20 delta
- ST (200:50), 25 point wings, 20 delta
- The next best reading was 0.17% and was associated with two test runs:
- ST (200:50), 50 point wings, 20 delta
- ST (200:50), 75 point wings, 20 delta
- The top 22 readings were all associated with a profit level of 50%
- Of these 22 readings, 18 were associated with a short delta of 20

 |
| (click to enlarge) |
Normalized P&L per Trade
The normalized P&L per trade charts display returns expressed as a percentage of the max risk for a particular test run.
We see the following in the data:
- The variability in normalized P&L per trade again increases as the delta of the short strike increases, and decreases with increasing wing width
- The largest normalized P&L per trade was 5.2% for the DN (NA:50), 25 point wings, 20 delta
- The top 7 P&L per trade variations were all associated short strike deltas of 20
- The top 4 P&L per trade variations were all associated with profit taking at 50%
- The top 3 trades in terms of P&L per day were also in the top three in terms of P&L per trade, but in a different order
- The 45 DTE ICs have slightly larger P&L per trade readings than the 38 DTE ICs ( avg 2.23% / sd 0.87% VS avg 1.88% / SD 0.75%)

 |
| (click to enlarge) |
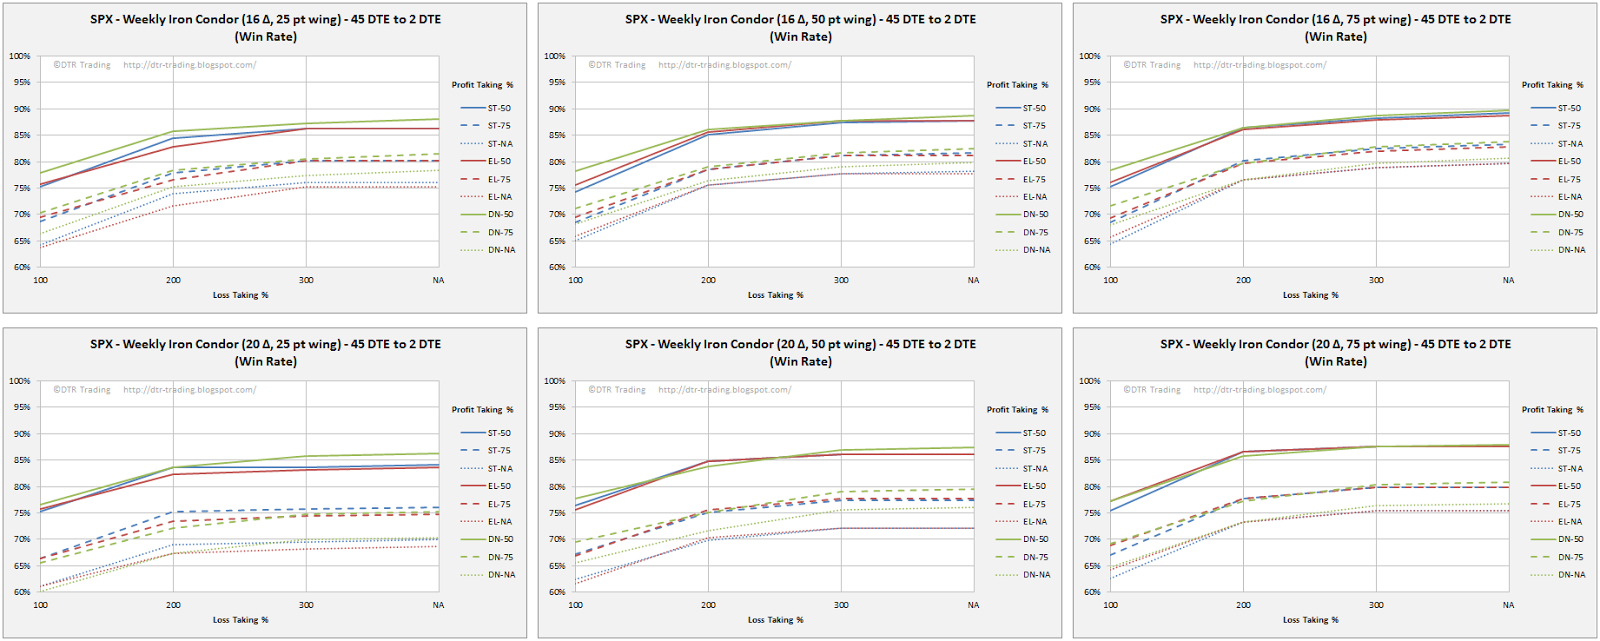
Win Rate
The chart structure should be familiar to you by now, so I'll not review the chart layouts. The win rate trends are clear:
- In general, win rates tend to increase as wing widths increase
- Win rates tend to increase as the delta of the short strike decreases
- The top win rate was 95%, and was associated with these strategies:
- DN (NA:50), wing width 75, 8 delta
- DN (NA:50), wing width 25, 8 delta
- The top 26 strategies all had win rates of 91% or better.
- Of these 26, 19 took profits at 50%
- Of these 26, 21 did not use loss exits (they exited at 2 DTE)
- Of these 26, 20 had short strike deltas of 8
- The strategies with the top win rates also had some of the largest single losses...as you'd expect for strategies not using loss exits
- The win rates for the 45 DTE ICs were similar to the win rates for the 38 DTE ICs

 |
| (click to enlarge) |
Largest Loss
The next charts show the normalized largest loss for each of the test runs These largest losses are expressed as a percentage of the max defined risk number for all of the 200+ trades in a test run.
The results:
- The largest loss percentage increases with increasing short strike delta
- The largest loss percentage increases with increasing loss taking level
- 39 strategy variations had largest loss readings of 95% or greater
- All 39 carried trades to 2 DTE and did not use loss taking levels
- All wing widths, short strike deltas, and structures (ST, DN, EL) were present in these 39 strategy variations
- The top 9 smallest losses all occurred with strategies with 75 point wing widths and 8 delta short strikes. The top three were:
- DN (100:50), 75 point wings, 8 delta -> 15% loss
- DN (100:75), 75 point wings, 8 delta -> 15% loss
- DN (100:NA), 75 point wings, 8 delta ->17% loss

 |
| (click to enlarge) |
Profit Factor
The best 14 profit factors were associated with delta neutral (DN) trades. The top 10 of these 14 had 8 delta short strikes. The top 9 of these 14 had profit factors of 2.0 or greater.
The results:
- The top performers were:
- DN (NA:50), 25 point wings, 8 delta -> 2.4 (win rate 95%)
- DN (NA:50), 75 point wings, 8 delta -> 2.2 (win rate 95%)
- DN (NA:75), 75 point wings, 8 delta -> 2.1 (win rate 93%)
- DN (NA:NA), 75 point wings, 8 delta -> 2.1 (win rate 89%)
- These top performers also had some of the largest single losses due to not implementing loss taking exits

 |
| (click to enlarge) |
Average DIT For Winning Trades
This metric was derived by averaging all of the DIT for all of the winning trades in a test run. Adding a DIT exit to your profit and loss exits is worth considering.
Here are a few trends:
- The larger the delta of your short strikes the longer you'll need to stay in your trades
- The larger your profit taking level, the longer you'll need to stay in your trade
- The 50% profit taking level should have you out of your trade between 16 and 26 days for a 45 DTE IC
- The smallest winning trade DITs of 16 were associated with 8 delta short strikes, profit taking at 50%, and loss taking at 100%...the structure type (ST, EL, DN) did not matter as seen in the charts

 |
| (click to enlarge) |
Part 2 will be published some time next week and will compare the weekly trades with the monthly trades.
Follow my blog by email, RSS feed or Twitter (@DTRTrading). All options are available on the top of the right hand navigation column under the headings "Subscribe To RSS Feed", "Follow By Email", and "Twitter".
2 comments:
I just want to say I love what you're doing here! Good job, the research is verifying everything I've learned and experienced about IC trading and what works for me:
- best to exit with 50% profit
- better to sell more puts than calls, market has upward skew
- stops hurt long-term performance, just size your positions for a few max losses and you'll be OK
I would love to see similar studies with 60 DTE...
Thanks again.
Thanks for the comment.
Regarding your question about 60 DTE, checkout my plan for this IC testing series at: http://dtr-trading.blogspot.com/2016/12/new-iron-condor-series-introduction.html
Thanks,
Dave
Post a Comment